
The Percent Chance of a Good Hire Puts One Number on How Likely a Candidate Is to Succeed
Every other score on the report tells you about one piece of a candidate. The percent chance of a good hire pulls those pieces into a single probability. It weights each one by how much that piece actually predicts. Then it tells you plainly how much confidence the result deserves.

What Is the Percent Chance of a Good Hire?
It is a prediction of how likely an applicant is to work out. It draws on past experience and research rather than on any single score. The marker computes the number from the full result set. However, the reading can move up or down when a candidate shows an unusual pattern across the charts.
Why this percentage is worth reading first
Reading it before anything else tells you how much of your own time a candidate has earned. Time is the scarce resource in any hiring process. Furthermore, the number stays honest about what it cannot see, which is exactly what makes it safe to act on.
| 90 | The ceiling. No assessment reads a resume or sits through an interview, so full certainty was never on offer. |
| 10 | The floor. An outlier can always appear, somebody who tests poorly and still produces very well once hired. |
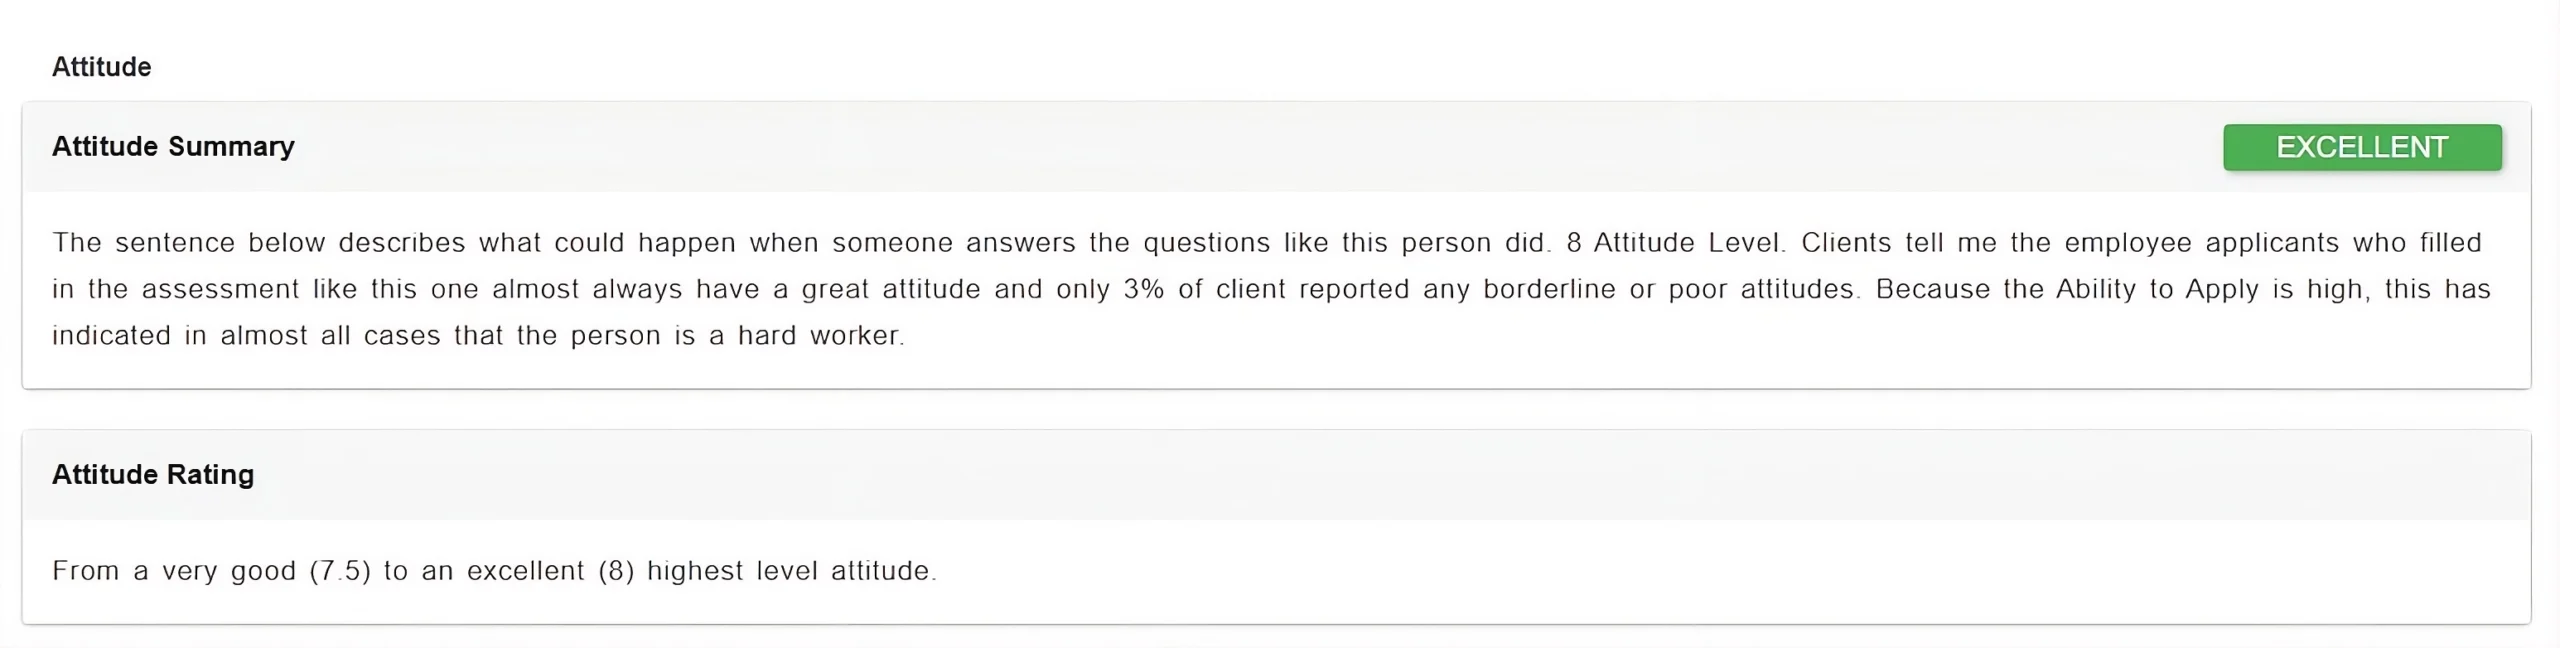
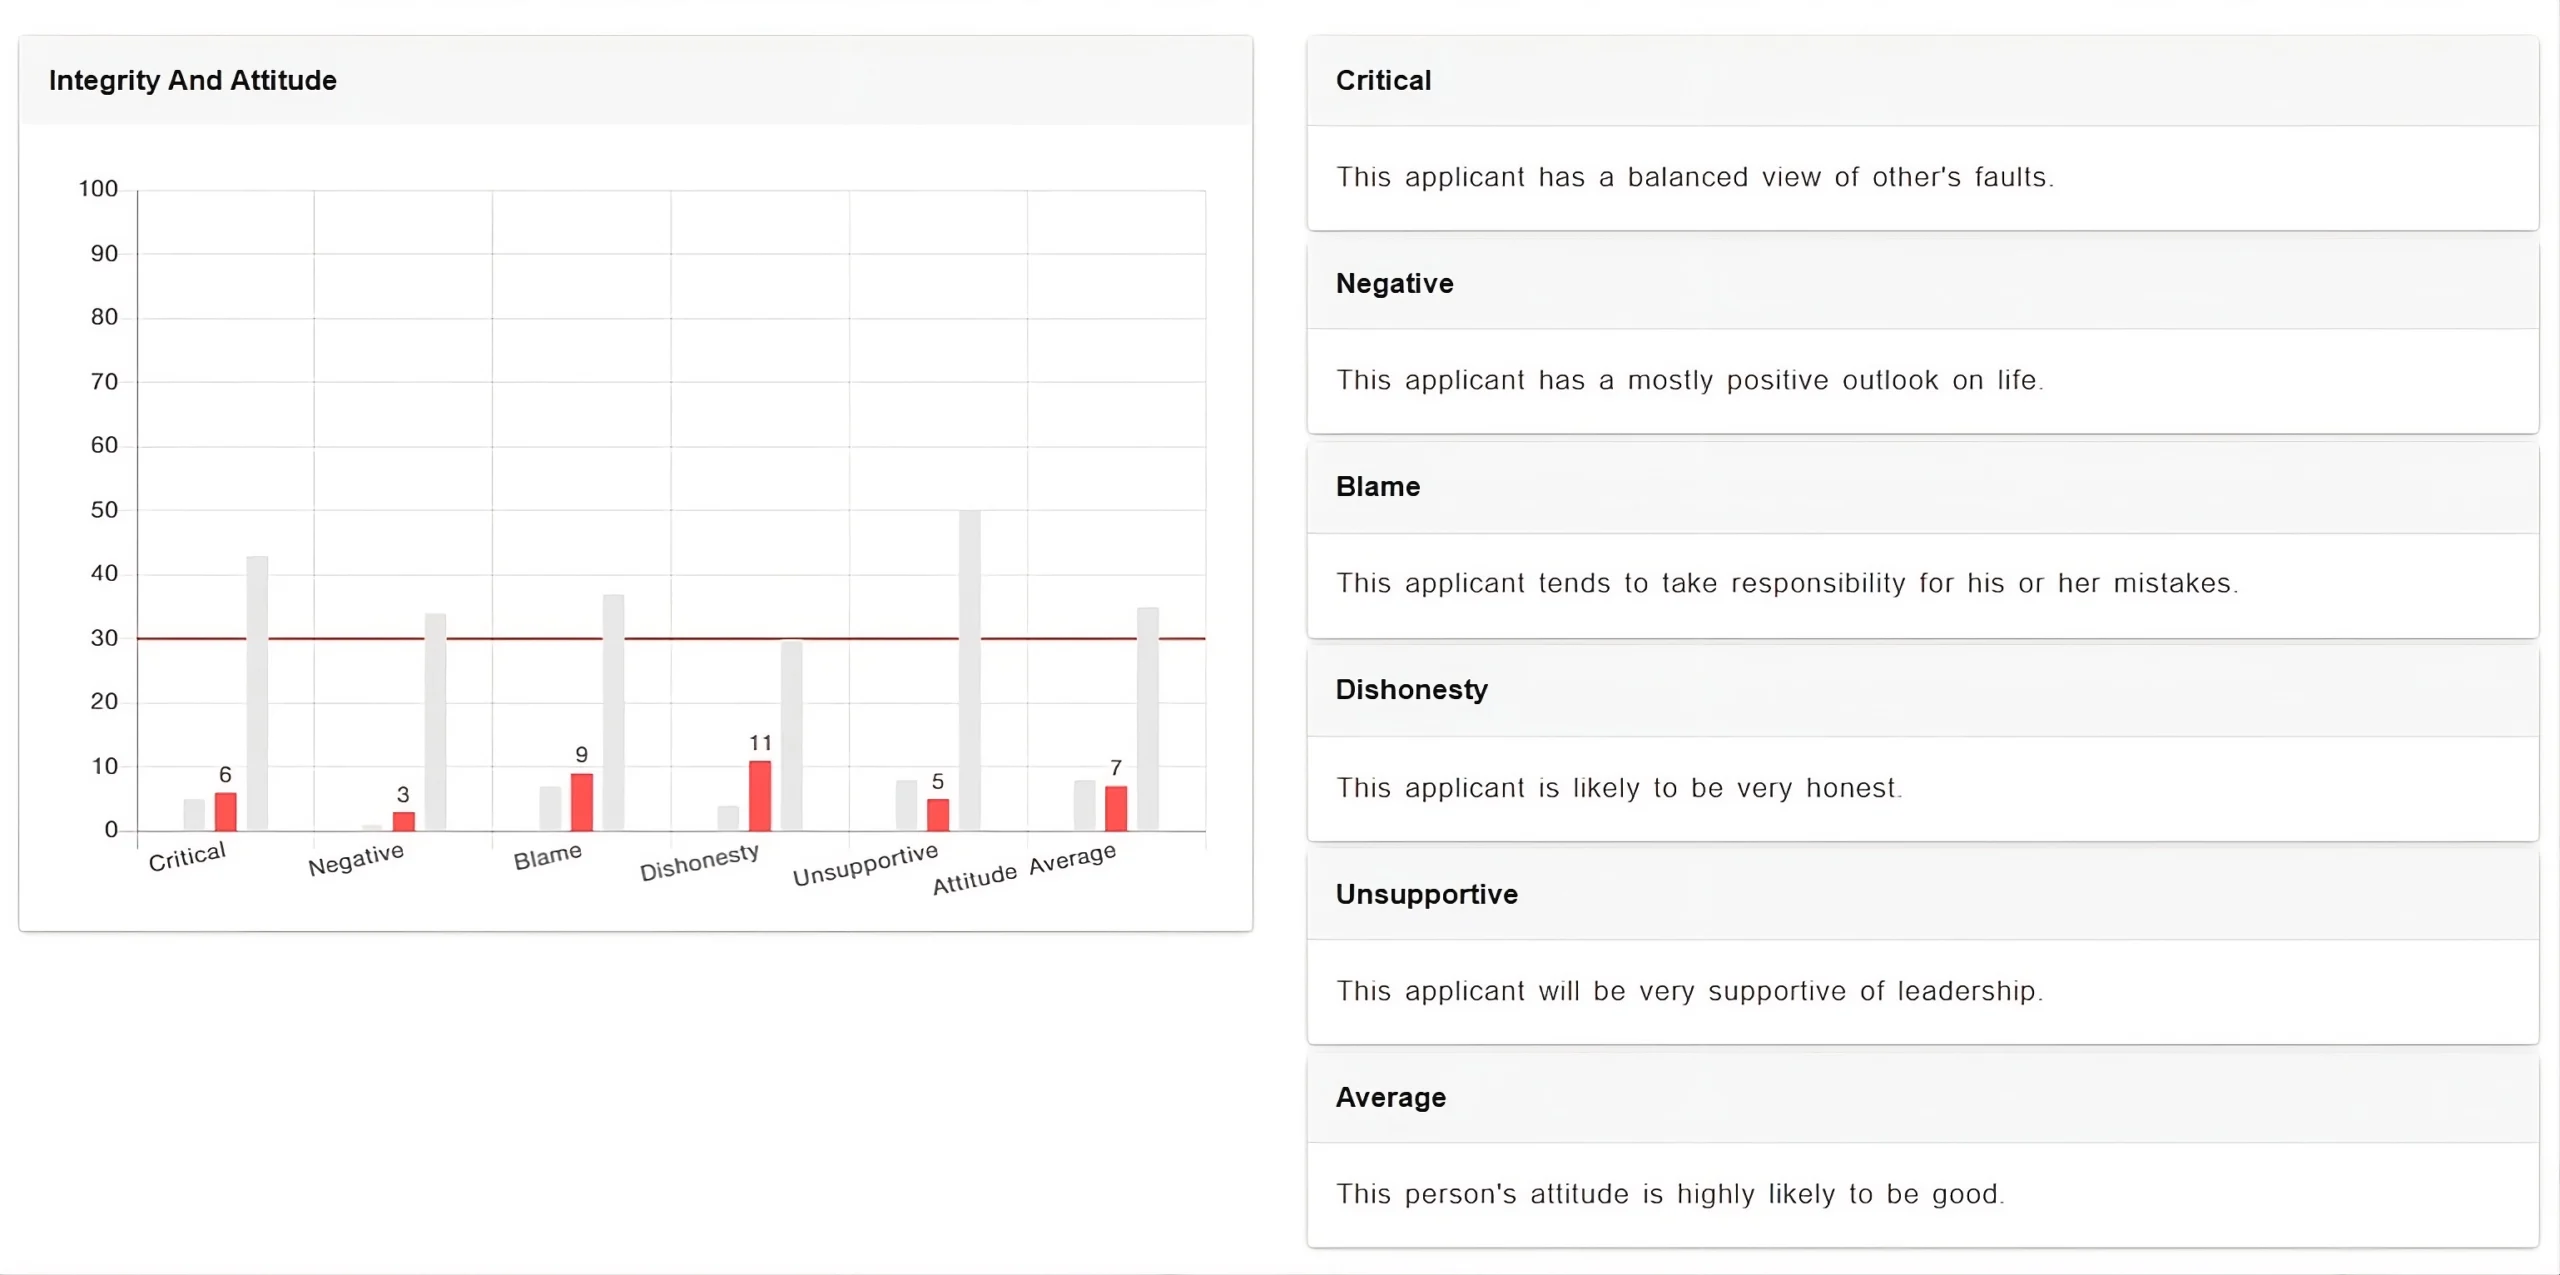
What the percent chance of a good hire helps you evaluate before you hire

Treat the percentage as a starting position rather than a verdict. A candidate at 75 can move up or down. Your own interviews and reference checks add what the assessment could not see.
Why the Percent Chance of a Good Hire Matters in Hiring
The value of this reading is not that it summarizes the others. It converts them into a decision about your own time. None of the individual scores can do that on their own.

One Number, Weighted Properly
Individual scores leave you deciding which ones count most. This reading has done that weighting, so competency and attitude arrive ranked instead of side by side.

Where Your Time Should Go
Deep reference checks cost hours you cannot spend on everybody. A high reading marks out the candidates where that investment is genuinely likely to pay off.

Speed Is Part of the Advice
A strong result comes with a warning about competitors, not just a rating. Consequently, this number drives a decision instead of merely describing one for you.

How a low percent chance of a good hire shows up on the job
A low reading rarely announces itself on day one. These are the patterns it turns into later.
Learn more about our Assessments
"*" indicates required fields
The Four Factors Behind the Percentage
The factors below carry different weight, and they appear in the order that weight follows. Reading them in order tells you why a number came out low. It also tells you which part of the report to open next.

01 Competency Results
The heaviest factor of the four. Competency carries more predictive weight than anything else here. A strong reading therefore lifts the percentage further than a strong reading on any other factor.

02 Attitude Level
The attitude reading comes next, together with any poor result in defensiveness or dishonesty. A weak showing on either of those two pulls the percentage down even when the attitude average looks acceptable.

03 Personality Quadrant
Compared against the position the person applied for rather than judged on its own. The same quadrant profile can raise the percentage for one seat and lower it for a different one entirely.

04 Accuracy of Results
How the candidate answered the questions decides how far the other three can be trusted. Heavy exaggeration and inconsistency lower the ability to predict anything, so they lower the percentage too.

Best practice: Never read the percentage without checking what produced it. Two candidates can reach the same number through different weaknesses. Only the four factors above show which one you actually have here.
How to Interpret the Percent Chance of a Good Hire
The percentage arrives already computed, so your job is deciding what it buys. Above 70 it buys deeper investigation, and above 80 it buys speed. Below 70 the report stops short of recommending that extra investment.
Below Threshold · 10 to 69
Under the range that justifies deeper investigation, though never a flat certainty about anything either.
Worth the Time · 70 to 79
Worth investing more time in further interviews and in checking this candidate's references properly first.
Move Quickly · 80 to 90
Strong enough that a competitor hiring this candidate before you do becomes the real risk.
When the score reads Unknown. An Unknown result is usually not a bad result. It appears when no competency test accompanied the behavioral assessment. Competency carries the most weight of anything in the calculation. Occasionally it appears because the candidate could not read English well enough for the answers to mean anything.
Why Attitude and Competency Multiply Instead of Adding
The rating exercise below is one you can run by hand on your own people. It sits on a separate ten by ten scale rather than the percentage above. Three lines of arithmetic show why a candidate cannot average their way out of a weakness.
| Example | Ratings out of ten | What the product predicts |
|---|---|---|
| Prima Donna | Competency 9, attitude 2 | Eighteen. Usually not worth the trouble he or she causes. |
| The yes person | Competency 2, attitude 9 | Eighteen. Just as bad as the Prima Donna, from the opposite direction. |
| Balanced employee | Competency 6, attitude 5 | Thirty. Adding gives the same eleven, yet this is a far better employee. |
Rate an employee out of ten on each half, then multiply the two numbers together.
| 25 or less | An unmanageable or incompetent employee, and not a profitable one either way. |
| 30 | The minimum worth hiring, and only in a tight labor market. |
| Above 30 | The higher the number climbs, the more profit that employee makes. |
One adjustment applies before you multiply. Drop the competency number by two when somebody has no real interest in the work. Do the same when the behavioral profile is wrong for the seat.
These thresholds belong to the rating exercise above, not to the percentage on your report. Thirty on this scale is not thirty percent on the report. The two numbers mean entirely different things.
What to Do Based on the Score
Check which of the four factors pulled the number down before you decide whether this candidate stays in the process.
Invest in more interviews and reference checks, then raise or lower the number yourself based on what you then find.
Make the offer as soon as possible, because a competitor moving faster is the likeliest way to lose this one.

Assessment results support your hiring decisions, they do not replace them. Always read the percent chance of a good hire alongside the full profile and your role benchmarks before drawing a conclusion.
Want to see a sample report?
Get a real example of what the IC or SL Behavioral report looks like — scores, trait breakdowns,
and interpretation guidance included.
Where the Percent Chance of a Good Hire Carries the Most Weight
The prediction applies to every seat you fill. Anybody on the payroll has to produce and to work alongside other people. Two situations raise the stakes enough to deserve a closer read of the components.
Two situations that raise the stakes
| Situation | Why it matters |
|---|---|
| High Producing Sales Roles | A top producer with a poor attitude can take the best leads and cap what the whole sales team sells. |
| Influential and Senior Roles | The more competent and productive somebody is, the more it matters that their integrity and attitude hold up as well. |
If any of these situations sound familiar, this assessment is for you
Frequently Asked Questions
The percent chance of a good hire predicts how likely an applicant is to work out in the job. It rests on past experience and research rather than on any one score. It draws on competency, attitude, quadrant fit against the position, and how reliably the candidate answered.
Let Our Team Help You Find the Right Assessment
Tell us about the position, hiring volume, and what you need to evaluate — and we'll recommend the exact assessment that fits your process.
Learn more about our Assessments
"*" indicates required fields